
How AI, Predictive Analytics, IoT, Digital Twins and BI Tools Are Redefining Warehouse & Production
Introduction
The role of a Warehouse Management System (WMS) is changing.
Traditionally, WMS has been viewed as an application for managing warehouse transactions such as receiving, putaway, inventory, picking, packing and dispatch.
But today’s manufacturing environment demands much more.
Warehouses are increasingly connected with ERP, MES, production systems, transportation platforms, RFID, IoT devices, automation and Business Intelligence (BI) Tools. Every transaction, movement and machine event generates data that can be transformed into operational intelligence.
The next generation of WMS is therefore not simply about managing inventory.
It is about using data to answer four fundamental questions:
-
- What happened?
-
- Why did it happen?
-
- What is likely to happen next?
-
- What should we do about it?
This evolution can be represented as:
WMS → Connected WMS → Analytical WMS → Predictive WMS → Intelligent WMS → Autonomous Operations
The convergence of WMS, AI, IoT, analytics and digital twins is increasingly being explored as a way to create predictive and self-optimizing warehouse operations. (IDCEA)
1. From Transaction Processing to Operational Intelligence
A conventional WMS executes transactions.
For example:
Goods Receipt
↓
Material Verification
↓
Putaway
↓
Inventory Update
↓
Picking
↓
Loading
↓
Dispatch
These transactions are essential, but each transaction also generates valuable data.
Consider a picking transaction :
-
- Material
-
- Quantity
-
- Batch/Lot
-
- Source bin
-
- Destination
-
- Order number
-
- Operator
-
- Equipment
-
- Start time
-
- Completion time
-
- Travel distance
-
- Exception details
Individually, these are operational records.
When analyzed collectively, they become business intelligence.
The organization can determine:
-
- Which materials move most frequently?
-
- Which locations create excessive travel?
-
- Which operators or shifts have higher productivity?
-
- Which orders are frequently delayed?
-
- Which materials are causing shortages?
-
- Which warehouse zones are approaching capacity?
This is where WMS begins to evolve from a system of record into a system of intelligence.
2. The Data Architecture of an Intelligent WMS
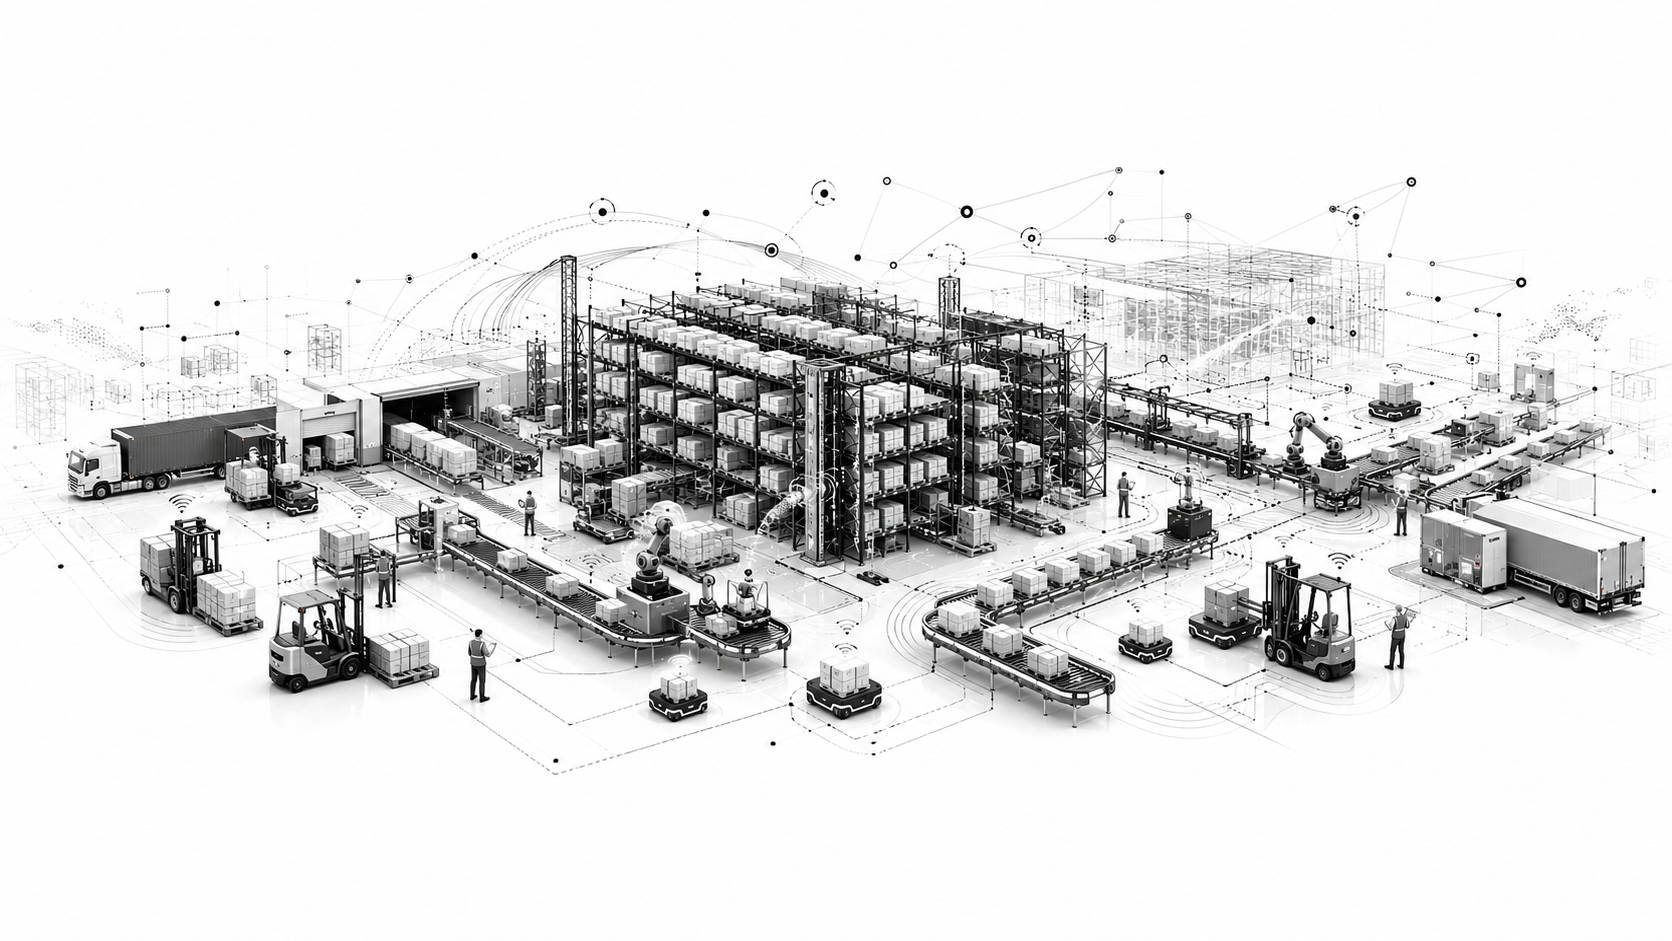
An intelligent WMS requires data from multiple operational sources.
A typical ecosystem can include:
Enterprise Systems
SAP / ERP
Provides:
-
- Material master
-
- Purchase orders
-
- Sales orders
-
- Production orders
-
- Inventory requirements
-
- Customer requirements
-
- Master data
Manufacturing Systems
MES
Provides:
-
- Production status
-
- Production quantities
-
- Material consumption
-
- Work orders
-
- Machine information
-
- Quality information
-
- Production requirements
Warehouse Systems
WMS
Provides:
-
- Inventory
-
- Bin/location
-
- Inbound
-
- Putaway
-
- Picking
-
- Replenishment
-
- Stock transfers
-
- Dispatch
-
- Warehouse tasks
Physical Data Sources
RFID / IoT / Automation
Provides:
-
- Material movement
-
- Asset location
-
- Equipment status
-
- Environmental conditions
-
- Machine data
-
- Real-time events
Intelligence Layer
BI Tools + AI + Predictive Analytics + Digital Twin
Converts these datasets into:
-
- KPIs
-
- Trends
-
- Alerts
-
- Predictions
-
- Recommendations
-
- Optimization decisions
Connected Architecture
SAP
↕
Integration Layer
↕
WMS
↕
MES
↓
RFID / IoT / Automation
↓
Data Platform
↓
BI Tools + AI + Predictive Analytics
↓
Digital Twin
↓
Decision & Optimization Engine
↓
WMS / MES Execution
3. AI-Powered WMS
Artificial Intelligence can significantly enhance rule-based WMS functionality.
Traditional WMS logic may be:
“If the material is received, assign the first available location.”
An intelligent WMS can evaluate multiple parameters:
Material velocity + historical demand + location utilization + future production demand + travel distance + batch constraints + shelf life + warehouse congestion
The system can then recommend the optimal action.
AI Use Case: Intelligent Putaway
The system can evaluate:
-
- Current bin availability
-
- Historical picking frequency
-
- Material compatibility
-
- Future demand
-
- Production requirements
-
- Travel distance
-
- Storage constraints
-
- Material characteristics
The objective becomes:
Put the material where it will create the highest operational value—not simply where space is available.
4. AI-Based Picking Optimization
Picking represents one of the most important warehouse activities.
An intelligent WMS can dynamically prioritize picking based on:
-
- Shipment priority
-
- Production requirements
-
- Customer priority
-
- Material availability
-
- Order due time
-
- Warehouse congestion
-
- Travel distance
-
- Operator workload
Instead of generating a static picking queue, the system can continuously optimize the workload.
Example
Production Order A requires Material X in 2 hours
↓
WMS identifies Material X
↓
Checks availability
↓
Checks location
↓
Checks current warehouse workload
↓
Prioritizes picking
↓
Stages material for production
This transforms picking from a simple task-execution process into a dynamic decision process.
5. Predictive Analytics: Knowing Before the Problem Happens
Traditional analytics is primarily retrospective.
It tells management what happened yesterday.
Predictive analytics introduces a different approach.
Example
Traditional WMS:
Material shortage occurred.
Predictive WMS:
Material X has a high probability of becoming unavailable within the next three days based on current consumption and upcoming production requirements.
This difference is significant.
Predictive Use Cases
Inventory Shortage Prediction
Predict potential shortages based on:
-
- Historical consumption
-
- Current stock
-
- Open orders
-
- Production requirements
-
- Incoming supply
-
- Lead time
Dispatch Delay Prediction
Identify orders that may miss dispatch cut-off based on:
-
- Picking progress
-
- Stock availability
-
- Warehouse workload
-
- Loading capacity
-
- Transportation schedules
Replenishment Prediction
Predict when a forward-picking location will reach a critical level.
Equipment Failure Prediction
Use IoT sensor information such as:
-
- Vibration
-
- Temperature
-
- Runtime
-
- Error frequency
to identify potential equipment problems.
AI-enhanced digital-twin research is increasingly focused on predictive maintenance, resource optimization and operational efficiency using Industrial IoT data. (ScholarWorks)
6. Digital Twin: Creating a Virtual Warehouse
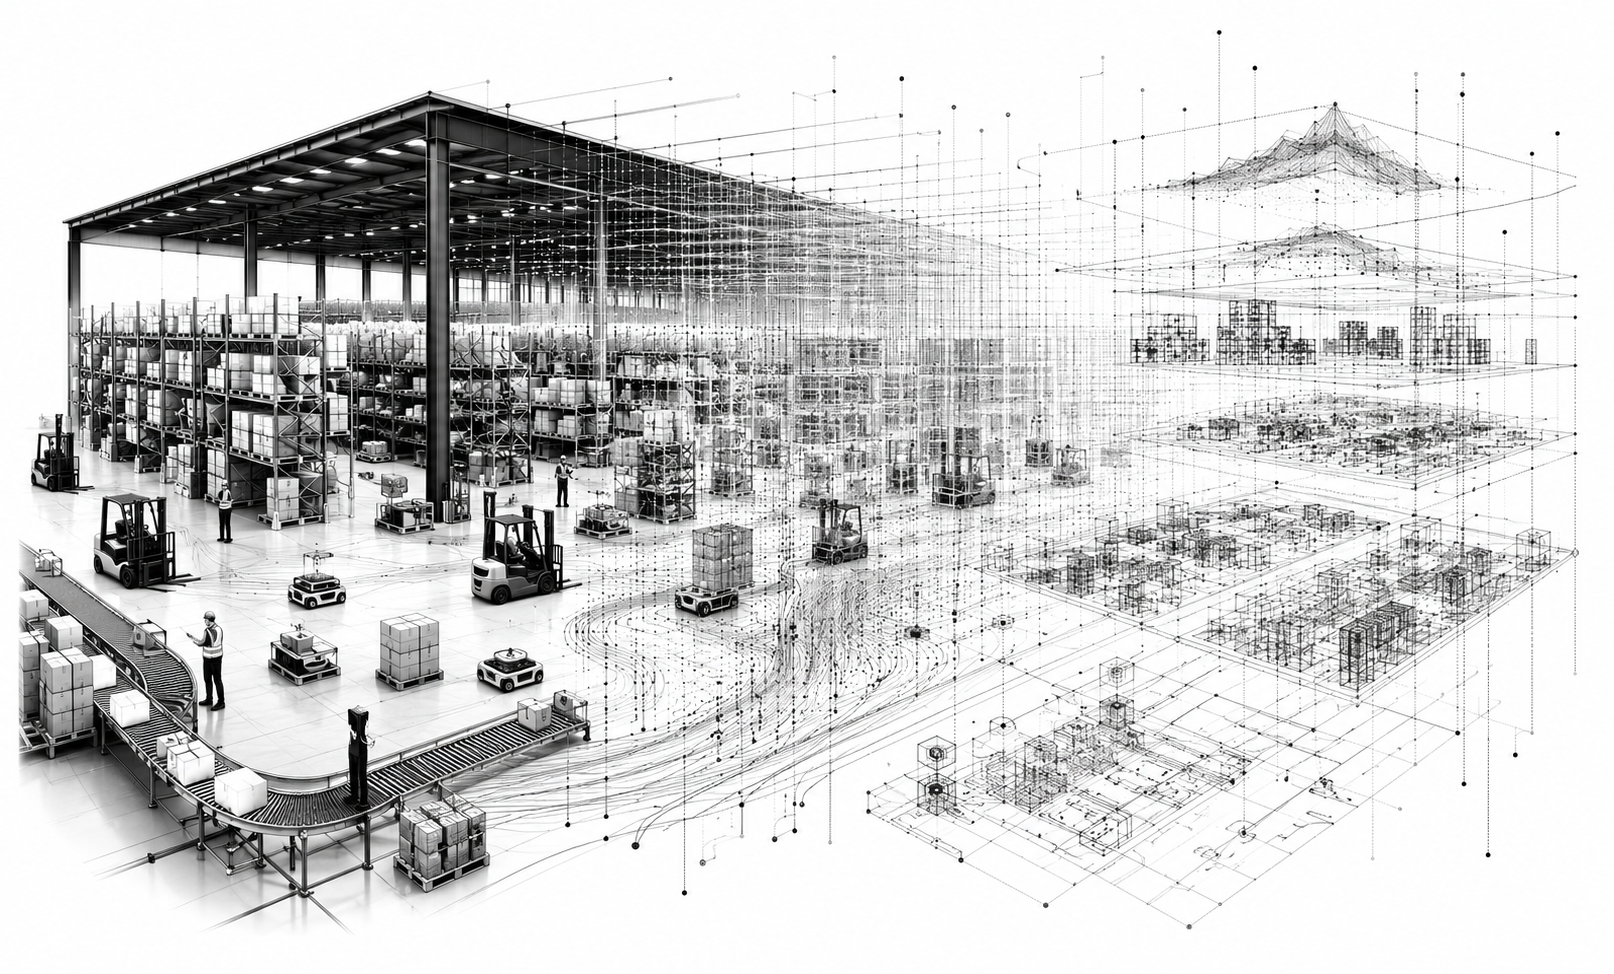
A Digital Twin can create a virtual representation of the physical warehouse.
It can represent:
-
- Warehouse layout
-
- Racks
-
- Bins
-
- Materials
-
- Inventory
-
- Orders
-
- Operators
-
- Forklifts
-
- Conveyors
-
- Automated equipment
-
- Material flows
Real-time data from WMS and IoT can continuously update the virtual environment.
The organization can then use the Digital Twin to monitor, simulate and optimize warehouse operations.
Fraunhofer describes logistics digital twins as virtual representations connected with real-time data, AI and IoT for monitoring, simulation and optimization. (Fraunhofer IML)
7. What-If Simulation
One of the most powerful capabilities of a Digital Twin is scenario simulation.
Management can ask:
-
- What happens if warehouse volume increases by 20%?
-
- What happens if we move the top 50 fast-moving materials closer to dispatch?
-
- What happens if one forklift becomes unavailable?
-
- What happens if production demand increases next month?
-
- What happens if the warehouse reaches 90% capacity?
Instead of implementing changes immediately in the physical warehouse, different scenarios can first be simulated digitally.
Decision Cycle
Current State
↓
Simulation
↓
Scenario Comparison
↓
Optimization
↓
Physical Implementation
↓
Performance Measurement
This creates a data-driven approach to warehouse redesign.
Digital twins can also sit alongside existing supply-chain systems to evaluate scenarios and improve operational decisions rather than requiring replacement of the existing technology stack. (McKinsey & Company)
8. RFID & IoT: Connecting the Physical Warehouse
A WMS knows about physical activities primarily through transactions.
RFID and IoT can provide direct visibility into the physical environment.
RFID
RFID can support:
-
- Automated material identification
-
- Pallet tracking
-
- Container tracking
-
- Gate validation
-
- Automated receiving
-
- Dispatch verification
-
- Movement tracking
IoT
IoT can provide:
-
- Forklift location
-
- Equipment status
-
- Temperature
-
- Humidity
-
- Vibration
-
- Conveyor status
-
- Energy consumption
-
- Machine condition
Architecture
Physical Event
↓
RFID / IoT Sensor
↓
Edge / Integration Layer
↓
WMS
↓
Analytics
↓
AI / Decision Engine
↓
Operational Action
This creates a much more connected warehouse.
However, data quality becomes critical. Sensor accuracy and data integrity directly affect the reliability of AI, predictive analytics and digital-twin outputs. (Express Computer)
9. Event-Driven WMS
The future of warehouse integration will increasingly move toward event-driven architecture.
Consider an RFID-enabled receiving process:
RFID detects pallet
↓
Event generated
↓
Integration layer receives event
↓
WMS validates pallet
↓
Inventory transaction created
↓
Putaway recommendation generated
↓
Operator receives task
↓
Material moved
↓
RFID confirms destination
↓
WMS updates inventory
↓
BI platform records transaction
This minimizes manual intervention and creates complete traceability.
The same architecture can be applied to:
-
- Picking
-
- Replenishment
-
- Production staging
-
- Loading
-
- Dispatch
-
- Stock movement
10. WMS–SAP–MES Integration
For manufacturing organizations, WMS cannot operate effectively as an isolated system.
The integration between SAP, MES and WMS creates a digital material-flow ecosystem.
SAP / ERP
Business Planning
Provides:
-
- Production orders
-
- Sales orders
-
- Purchase orders
-
- Material master
-
- Business requirements
MES
Production Execution
Provides:
-
- Production status
-
- Material consumption
-
- Work orders
-
- Production quantities
-
- Production requirements
WMS
Material Execution
Provides:
-
- Inventory
-
- Allocation
-
- Picking
-
- Staging
-
- Warehouse movement
-
- Production supply
Information Flow
SAP
↓
Production Requirement
↓
MES
↓
Material Requirement
↓
WMS
↓
Material Allocation
↓
Picking
↓
Production Staging
↓
MES Consumption
↓
SAP Update
This creates a closed-loop digital material flow between business planning, production and warehouse execution.
11. WMS as a Production-Enabling Platform
The warehouse should not simply respond to production requirements.
It should anticipate them.
For example:
Production Plan
↓
Future Material Demand
↓
Inventory Availability Analysis
↓
Shortage Risk Prediction
↓
Prioritized Replenishment
↓
Picking
↓
Production Staging
↓
Line Supply
This approach can reduce:
-
- Production waiting time
-
- Material shortages
-
- Emergency picking
-
- Excess inventory
-
- Manual communication
-
- Production disruptions
The warehouse becomes a production-enabling function rather than a downstream support function.
12. BI Tools: Turning Data Into Management Intelligence
WMS generates operational data.
BI Tools convert that data into meaningful information for different levels of the organization.
Executive Dashboard
Management can monitor:
-
- Inventory accuracy
-
- Inventory value
-
- Warehouse utilization
-
- Order fulfillment
-
- Dispatch performance
-
- Productivity
-
- Production material availability
Warehouse Dashboard
Operations teams can monitor:
-
- Pending receiving
-
- Putaway backlog
-
- Picking backlog
-
- Replenishment
-
- Bin utilization
-
- Stock aging
-
- Operator productivity
Production Dashboard
Production teams can monitor:
-
- Material availability
-
- Production order status
-
- Line-side inventory
-
- Material shortages
-
- Consumption
-
- Production supply TAT
The objective is not to create hundreds of reports.
The objective is to create actionable visibility.
13. From Dashboard to Decision Cockpit
A mature analytics platform should go beyond KPI visualization.
Consider:
KPI
Picking Productivity: 82 Lines/Hour
Target
100 Lines/Hour
Variance
-18%
Root Cause
High travel distance in Zone C.
Analytical Insight
A small group of fast-moving materials accounts for a significant percentage of picker travel.
Recommendation
Re-slot high-frequency materials closer to the dispatch area.
Expected Impact
Reduced travel distance and improved picking productivity.
This is the difference between:
Reporting
and
Operational Intelligence.
14. Advanced Analytics for Warehouse Optimization
Once sufficient historical data is available, organizations can build advanced analytical models.
FSN Analysis
Classify materials into:
-
- Fast Moving
-
- Slow Moving
-
- Non-Moving
This can support:
-
- Slotting
-
- Inventory optimization
-
- Space planning
-
- Replenishment
ABC Analysis
Analyze materials based on:
-
- Inventory value
-
- Consumption value
-
- Business criticality
Order Pattern Analysis
Identify:
-
- Frequently ordered combinations
-
- Materials commonly picked together
-
- High-frequency order profiles
This can support intelligent storage and picking strategies.
TAT Analytics
Analyze:
Order Creation → Allocation → Picking → Loading → Dispatch
to identify process bottlenecks.
15. AI + BI Tools: The Next Analytics Model
Traditional BI requires users to navigate dashboards.
AI can introduce a conversational layer.
Instead of searching through multiple reports, a manager could ask:
“Why did warehouse productivity decline this week?”
The system could analyze:
-
- Picking performance
-
- Order volume
-
- Operator productivity
-
- Location distribution
-
- Equipment utilization
-
- Warehouse congestion
and provide a structured explanation.
Similarly:
-
- “Which materials are likely to become critical next week?”
-
- “Which warehouse zones are underutilized?”
-
- “Which orders are at risk of missing dispatch?”
-
- “What caused the increase in putaway TAT?”
The combination of BI Tools + AI can therefore move analytics from dashboard-driven reporting to decision-driven intelligence.
16. The Intelligent WMS Architecture
A future-ready WMS architecture can be represented as:
Layer 1 — Physical Layer
RFID | Barcode | HHT | Sensors | PLC | Machines | AMR/AGV
↓
Layer 2 — Connectivity Layer
APIs | TCP/IP | OPC UA | MQTT | Edge Computing | Event Processing
↓
Layer 3 — Enterprise & Operations
SAP / ERP | WMS | MES | TMS | Quality Systems
↓
Layer 4 — Data Platform
Operational Database | Data Warehouse | Data Lake/Lakehouse | Historical Data
↓
Layer 5 — Analytics
BI Tools | KPI Engine | Dashboards | Advanced Analytics
↓
Layer 6 — Intelligence
AI | Machine Learning | Predictive Analytics | Optimization Algorithms
↓
Layer 7 — Digital Twin
Simulation | Scenario Analysis | Capacity Modeling | Process Optimization
↓
Layer 8 — Execution
Recommendations | Task Prioritization | Automated Alerts | WMS/MES Actions
This architecture creates a continuous feedback loop between the physical warehouse and digital intelligence layer.
17. The Closed-Loop Warehouse
The ultimate objective is to establish a closed-loop operating model.
Sense
RFID, IoT and operational systems capture events.
↓
Understand
WMS and BI Tools provide visibility.
↓
Analyze
Analytics identifies patterns and root causes.
↓
Predict
AI predicts future risks and requirements.
↓
Decide
Optimization engines recommend actions.
↓
Execute
WMS/MES executes the required tasks.
↓
Learn
The system measures outcomes and improves future decisions.
This creates:
Sense → Analyze → Predict → Decide → Execute → Learn
That is the foundation of an intelligent warehouse.
18. Data Governance : The Foundation of AI
AI and analytics are only as reliable as the data feeding them.
Organizations therefore need strong governance around:
-
- Material master
-
- UOM
-
- Location master
-
- Batch/Lot
-
- Inventory
-
- Order status
-
- Production data
-
- RFID identifiers
-
- Equipment data
-
- Transaction timestamps
A Digital Twin built on inaccurate data will produce inaccurate simulations.
An AI model trained on poor transaction data will produce unreliable recommendations.
Therefore:
Data Quality → Analytics Quality → AI Quality → Decision Quality
Data governance is not an IT-only responsibility.
It is an operational requirement.
19. Measuring the Business Impact
Technology adoption should ultimately be measured by business outcomes.
Inventory
-
- Inventory accuracy
-
- Stockout reduction
-
- Inventory aging
-
- Inventory turnover
Warehouse
-
- Picking productivity
-
- Putaway productivity
-
- Travel distance
-
- Space utilization
-
- Order fulfillment time
Production
-
- Material availability
-
- Production waiting time
-
- Material-related line stoppages
-
- Production schedule adherence
Supply Chain
-
- On-time dispatch
-
- Order fulfillment
-
- Warehouse-to-customer lead time
Digital Transformation
-
- Manual transactions eliminated
-
- Automated transactions
-
- Predictive alerts
-
- AI-assisted decisions
-
- Real-time visibility
The question should not be:
“How many dashboards or AI models have we implemented?”
The real question should be:
“What measurable improvement has the technology created?”
20. The Roadmap Toward Autonomous Warehouse Operations
Organizations do not need to implement every technology at once.
A practical roadmap can be:
Phase 1 — Digitize
Implement core WMS processes.
Goal: Eliminate manual transactions.
Phase 2 — Connect
Integrate:
WMS + SAP + MES + RFID + IoT
Goal: Establish real-time visibility.
Phase 3 — Analyze
Introduce:
BI Tools + KPI + Advanced Analytics
Goal: Understand operational performance.
Phase 4 — Predict
Introduce:
Predictive Analytics + Machine Learning
Goal: Identify future risks.
Phase 5 — Optimize
Introduce:
AI + Optimization + Digital Twin
Goal: Recommend the best operational decisions.
Phase 6 — Automate
Connect recommendations to:
WMS + MES + Automation
Goal: Create closed-loop execution.
Conclusion
The future of WMS is not simply about managing warehouse transactions.
It is about creating an intelligent operational ecosystem.
The combination of:
WMS + SAP + MES + RFID/IoT + BI Tools + AI + Predictive Analytics + Digital Twin
can connect the physical warehouse with digital intelligence.
The result is a transformation from:
Reactive → Proactive
Manual → Automated
Historical → Predictive
Rule-Based → AI-Assisted
Warehouse-Centric → Production-Connected
Data Reporting → Data-Driven Decisions
Ultimately, the intelligent WMS should not only tell an organization where inventory is.
It should help determine:
-
- Where inventory should be stored.
-
- What should be picked first.
-
- When replenishment should happen.
-
- Which production orders are at risk.
-
- Where bottlenecks will occur.
-
- How warehouse capacity should be optimized.
-
- What action should be taken next.
The warehouse of the future will not be defined simply by how much automation it contains.
It will be defined by how intelligently it can sense, analyze, predict, decide and respond.